We’re excited to introduce a new enhancement to our PDF report exports – the ability to add a campaign map!
Now, when exporting a campaign report, you can include a map that visually represents your campaign’s activity, making it easier to analyze coverage and performance.
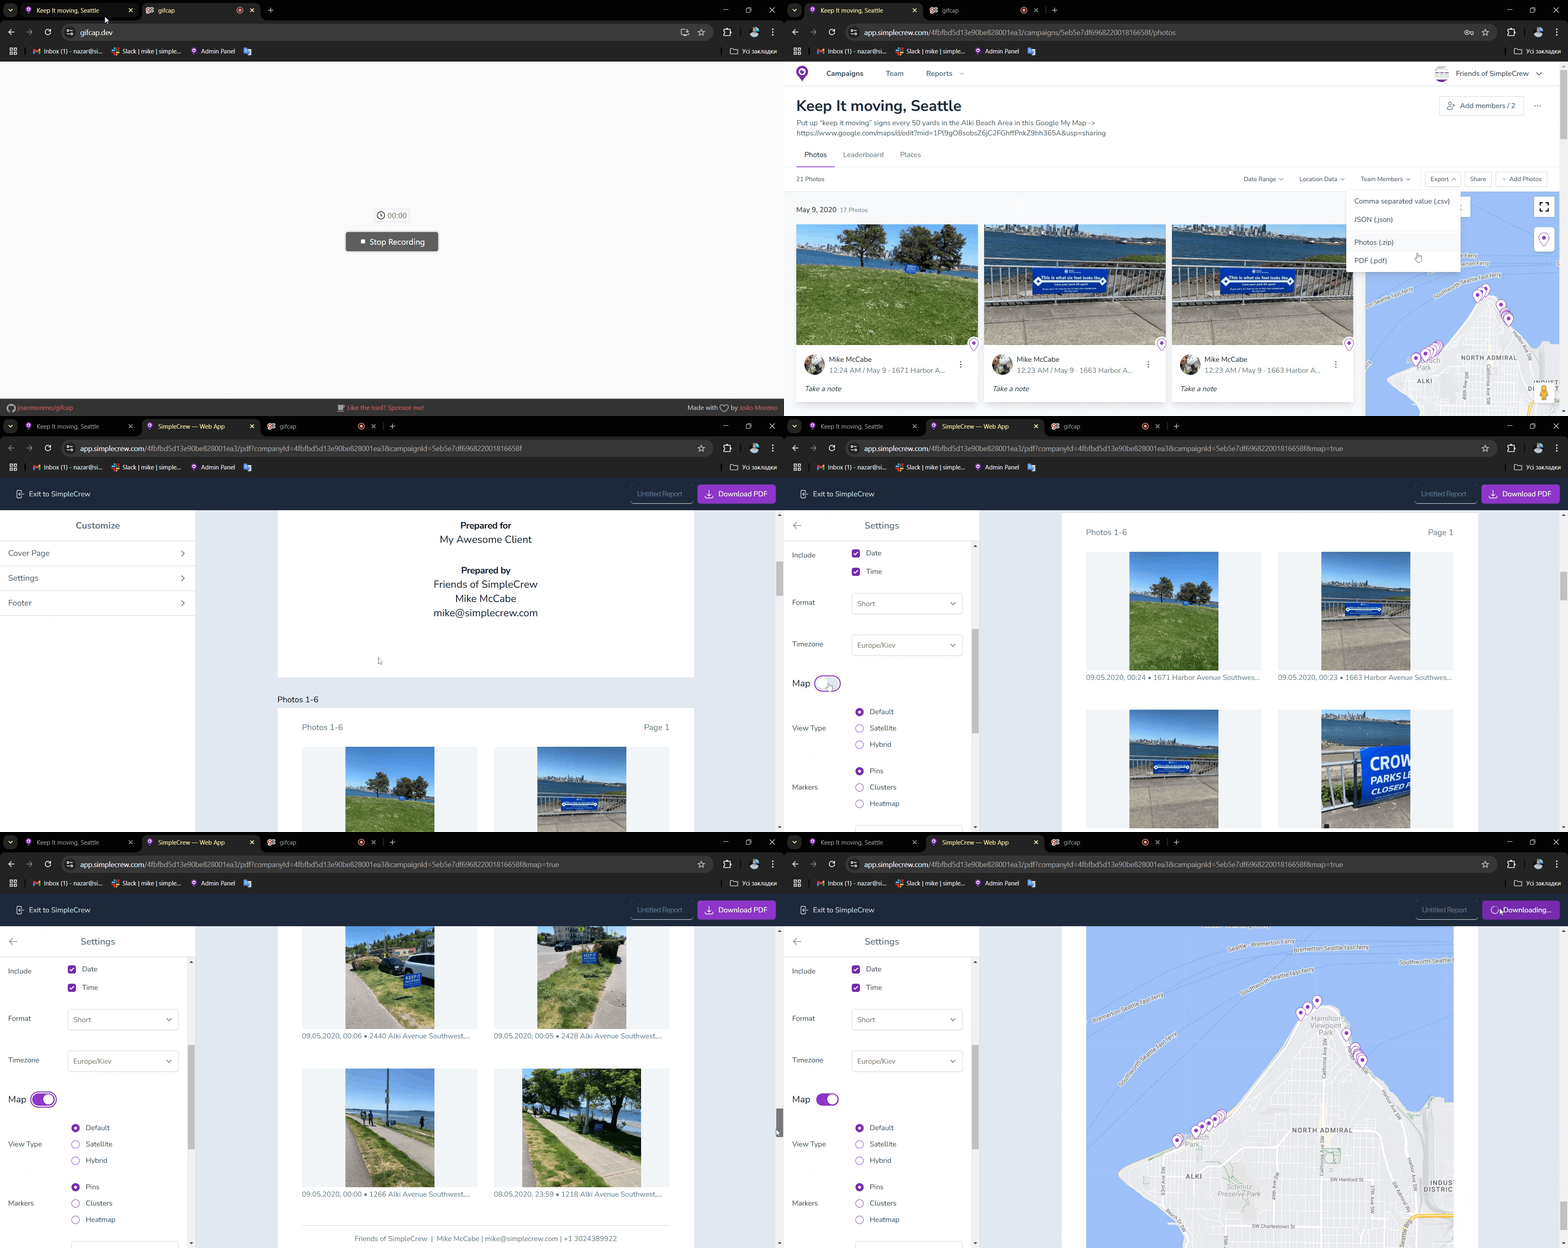
How to Add a Map to Your PDF Report
- Open your campaign in SimpleCrew.
- Click ‘Export’ → ‘PDF’.
- In the PDF report constructor window, expand the ‘Settings’ section.
- Toggle ‘Map’ ON.
The map will be added to the last page of your report.

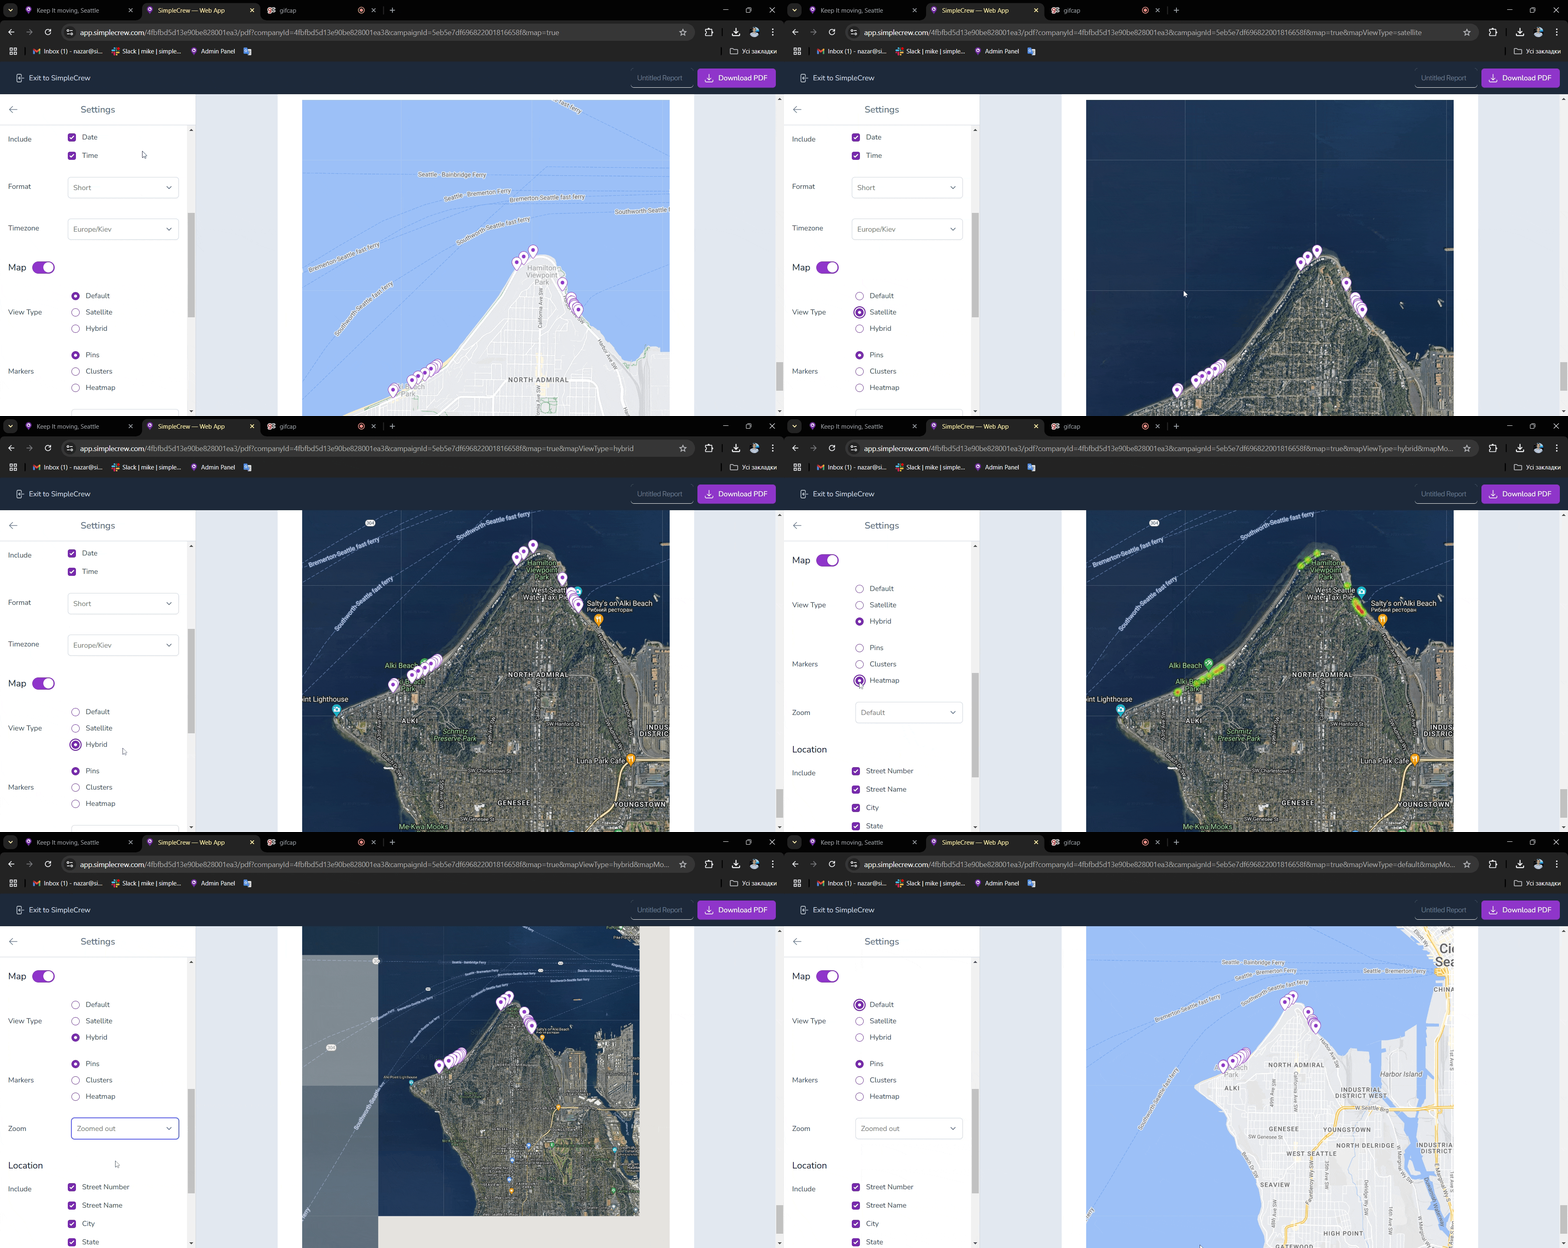
Customize Your Campaign Map
We’ve built flexibility into this feature. You can customize your campaign map to best suit your reporting needs:
- Map View Type: Choose between default, satellite, or hybrid views to match your preference.
- Photo Markers: Display locations using pins, clusters, or a heat map for better visualization.
- Zoom Control: Adjust the zoom level to focus on specific areas or get a broader campaign overview.

Why Use the Campaign Map Feature?
- Better Insights – See exactly where campaign activities took place.
- More Clarity – Easily communicate campaign reach and impact with your team or clients.
- Professional Reports – Enhance the look and effectiveness of your exported reports.
This new feature makes it even easier to track, analyze, and showcase your campaign results in a clear, visually compelling format.
Another improvement in the PDF report is that all the settings you adjust in the Settings section will now be saved across all reports. This means you won’t need to reconfigure them each time.
In case of any questions or ideas, reach out to us at [email protected].


